

1.Installation of Prometheus
2.How to create & install Node Exporter
3.Install the Grafana
4.Setting up the Grafana Dashboard
5.Advantages of Prometheus
6.Advantage of Grafana
Performance monitoring and alerting are very crucial to measure the performance metrics of an application running in a production environment. In this blog post, we are going to talk about two popular open-source tools Prometheus and Grafana. This blog post is aimed at anyone who is trying to learn Prometheus and Grafana or has some experience with these tools.
What is Prometheus – It is an open-source tool for scrapping the performance metrics of any given hardware resource (CPU, VM, Cloud Virtual Machine, Router, etc.). Prometheus scraps the data with the timestamp which can be stored on a server and accessed using the PromQL. Prometheus has superb support API which makes Prometheus integration with any resource present in the Datacenter. Prometheus architecture is really scalable and 3rd party libraries and makes it more powerful.
What is Grafana – In Lehman’s term Grafana is a user interface for viewing the metrics scraped by Prometheus from various resources. Grafana is an open-source analytics and visualization tool. Grafana does not store any data, but instead, it relies on Prometheus to send the data so that dashboard can be prepared. Also, Grafana is used for sending notifications and mail alerts based on various thresholds. One of the cool features of the Grafana is Grafana Labs where you can go and download the dashboard prepared by other developers so that you do not have to re-invent the wheel.
1. Installation of Prometheus
Prometheus has a various ways of installation for example – pre-compiled binaries, from source, Docker. But to keep the installation simple we are going to use the pre-compiled binaries for installing Prometheus onto my Ubuntu Linux machine.
Go to Download Page of Prometheus and select the prometheus-x.xx.x.linux-amd64.tar.gz file for download. (Note- Here x.xx.x is version number)
Extract the download binary file. (Note- Replace x.xx.x with the downloaded version of Prometheus)
tar xf prometheus-x.xx.x.linux-amd64.tar.gz
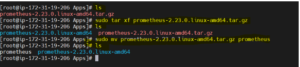
3. Go into the extracted directory cd prometheus-x.xx.x.linux-amd64.tar.gz
4.Start the Prometheus server with the command. /Prometheus
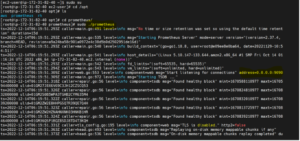
5. The Prometheus server should start on port 9090
6. You can access the Prometheus graph UI by visit http://localhost:9090/graph
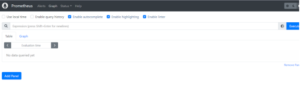
7. You can access the Prometheus metrics UI by Visit http://localhost:9090/metrics.
(I have used my Prometheus instance public IP)
2. How to create and Install Node exporter
Node exporter is responsible for fetching the statistics from various hardware and virtual resources in the format which Prometheus can understand and with the help of the Prometheus server those statistics can be exposed on port 9100.
There are many third-party Node exporters which can be used by SREs as well as DevOps based on their application needs. But primarily we look for the following metrics –
CPU usage
Memory usage
Disk usage
Network usage
2.1 How to Install Node exporter.
After installing the Prometheus in the previous step, the next package, we are going to install is **Node Exporter **. Node exported is used for collecting various hardware and kernel-level metrics of your machine.
Here are the download and installation steps –
Download the binary of Node exporter based on the operating system. (In my case I am using Ubuntu Linux machine)
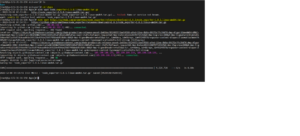
3. Extract the download node exporter binary file. (Note- Replace x.xx.x with the downloaded version of node exporter)
tar xf node_exporter-*.*-amd64.tar.gz
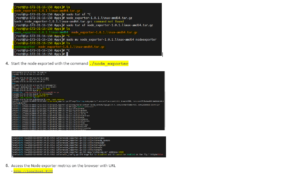
4.Go into the extracted directory sudo mv node_exporter-*.*-amd64.tar.gz nodeexporter


Leave feedback about this